Case Tree Plot Case tree plots
Case tree plot
What is a case tree plot?
I developed case tree plots as a way to visualize zoonotic disease. However, it can also be used to visualizing environmentally-acquired dieases, or anything that emerges multiple times, is passed from person to person, and then dies out. Tweets and retweets might be a useful non-epidemiological example.
How do I read a case tree plot?
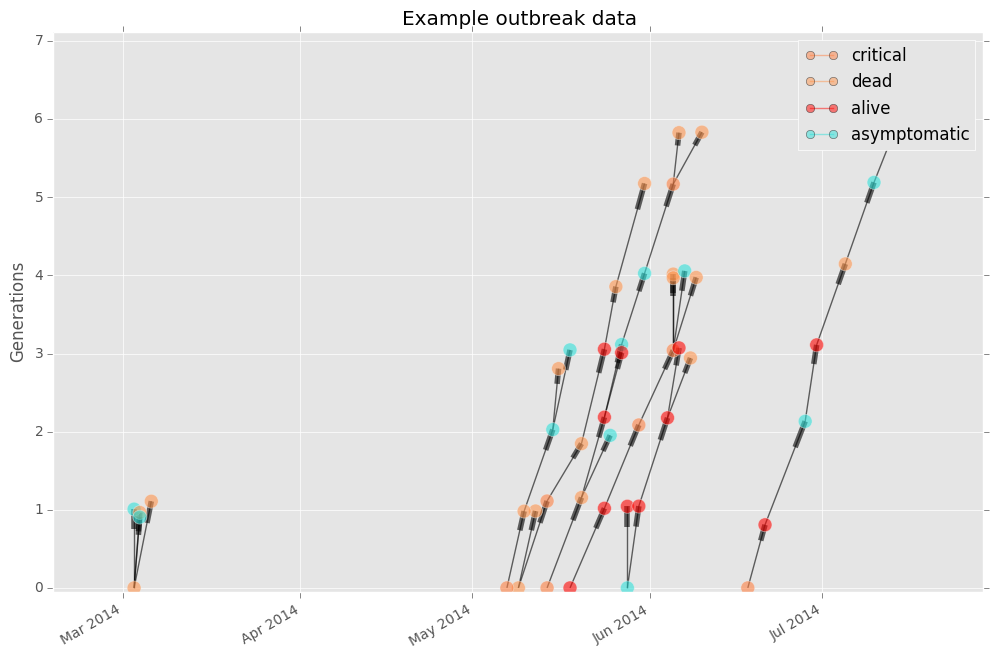
The x-axis is time of illness onset or diagnosis, and the y-axis is generation. Nodes at generation 0 are index nodes, or the emergence case. In the case of a zoonotic disease, the index node is a human case acquired from an animal source. If that human were to pass the disease to two other humans, those two subsequent cases are both generation 1.
The meaning of the color of the node varies based on the node attribute. In many cases, color just signifies membership to a particular human to human cluster. However, it could also represent health status (e.g. alive, dead), the sex of the patient, etc.
Examples
In order to build a case tree plot, provide the cluster identifier, case identifier, date column, generation mean (gen_mean) and generation standard deviation (gen_sd). These values represent the time from when one case becomes infected to when a subsequent case becomes infected. Incubation period may be used when generation time is not known.
import epipy
import pandas as pd

df = epipy.get_data('example_data')
fig, ax = epi.case_tree_plot(df, cluster_id = 'Cluster', case_id ='ID', \
          date_col='Date', color='Cluster', gen_mean=4, gen_sd = 1)

If you want to change the node color to represent the health status of each case, simply change the color argument.
fig, ax = epipy.case_tree_plot(df, cluster_id = 'Cluster', case_id ='ID', \
          date_col='Date', color='health', gen_mean=4, gen_sd = 1)
You can also turn the legend off, and change the size of the node using optional arguments.
  fig, ax = epi.case_tree_plot(df, cluster_id = 'Cluster', \
                case_id ='ID', date_col='Date', color='Cluster', \
                gen_mean=4, gen_sd = 1, node_size=25, legend=False)
